
Free Looker Studio GA4 Dashboard for Small Businesses
A six-page Data Studio template I built from my own GA4 data. Copy it, connect your property, and read your numbers in five minutes.
- Looker Studio is now called Data Studio. Google renamed it on 16 April 2026. The GA4 connector and the way you build a report are the same, and the old lookerstudio.google.com address still takes you there.
- I built a free six-page GA4 toolkit: Overview, Acquisition, Content, Revenue, Audience and a How to use page. Copy it, point it at your own GA4 property, and you're done.
- Each page answers one question: how am I doing, where do visitors come from, which pages work, what earns money, and who are they.
- Your dashboard can show slightly different numbers from GA4's own reports. Check the date range and data freshness before you assume something is broken.
- If a client or boss has no GA4 access, set the data source to use your credentials, or they will hit a "request access" wall.
Why I stopped sending owners into GA4
GA4's own reports are built for people who analyse data all day. Most owners I talk to don't want to learn that. They want the same few answers every month: are people coming, where from, are they sticking around, and is anyone doing the thing that pays the bills.
A dashboard fixes that. One page, the same layout every time, the same date range. You open it, you read it in five minutes, and you close it. That's all this post is about, and you can build it for free.
First, the name: Looker Studio is now Data Studio
If you search for this today, you'll find guides calling it Looker Studio and screenshots showing Data Studio. They're the same product. Google's release notes say, "We've rebranded Looker Studio as Data Studio," and date the change 16 April 2026. When I opened lookerstudio.google.com while writing this, it sent me to datastudio.google.com.
I'm keeping "Looker Studio" in the title because that's still what most people type into Google. Everything below uses the new name.
What is in the toolkit
One page isn't enough once you want to know where people come from or which pages work, so I split the toolkit into six pages. Every page has my logo, a date range control and four headline numbers, so it reads the same way each time:
| Page | The question it answers | What's on it |
|---|---|---|
| Overview | How is the site doing? | Sessions, engaged sessions, key events, total users, two trend lines, channel bar, top pages |
| Acquisition | Where do visitors come from? | New users, engagement rate, views per session, channel trend, source / medium table |
| Content | Which pages perform? | Views, event count, bounce rate, device trend, event bar, landing pages |
| Revenue | Which pages and channels earn money? | Total revenue, purchases, key events, session key event rate, revenue by channel and landing page, products table |
| Audience | Who visits, and on what device? | Users, device trend, countries, cities |
| How to use | How do I make it mine? | Five short setup steps inside the report |
Every block stays in the template even if your site has no data for it. My own Revenue page reads $0 because I don't run an online shop, but someone who does gets purchases, revenue by channel and a products table without building anything.
"Key events" is GA4's current name for what used to be called conversions. It's the actions you tell GA4 to treat as important, such as a form submission or a phone-number click.
The pages, with my own data
These are screenshots from my own report for digitalappears.com, taken on 4 November 2026, covering roughly the four weeks to 3 November.
1. Overview
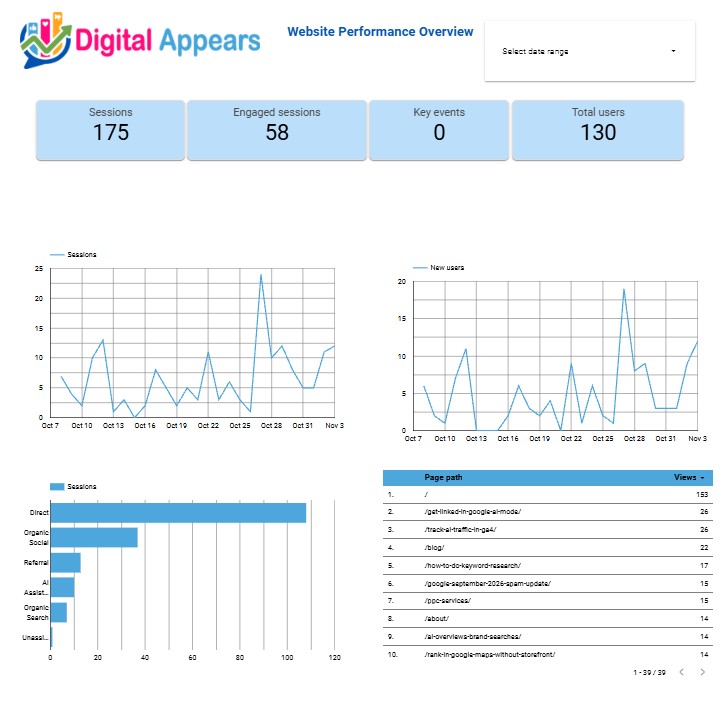
That's 175 sessions and 58 engaged sessions, so about a third of visits were engaged. My site is small, and that's the point. When you only get a few visits a day, one slow week stands out, so a small site gets more out of a dashboard, not less. My line has a one-day spike near the end of October, which is why I never judge a month from a single day.
The key events tile reads zero. That could mean nobody completed an action, or it could mean no actions are marked as key events in GA4 yet. The tile can't tell you which. You find out in GA4 under Admin and then Events. I'd rather learn that from a glance than from a quarterly review.
2. Acquisition
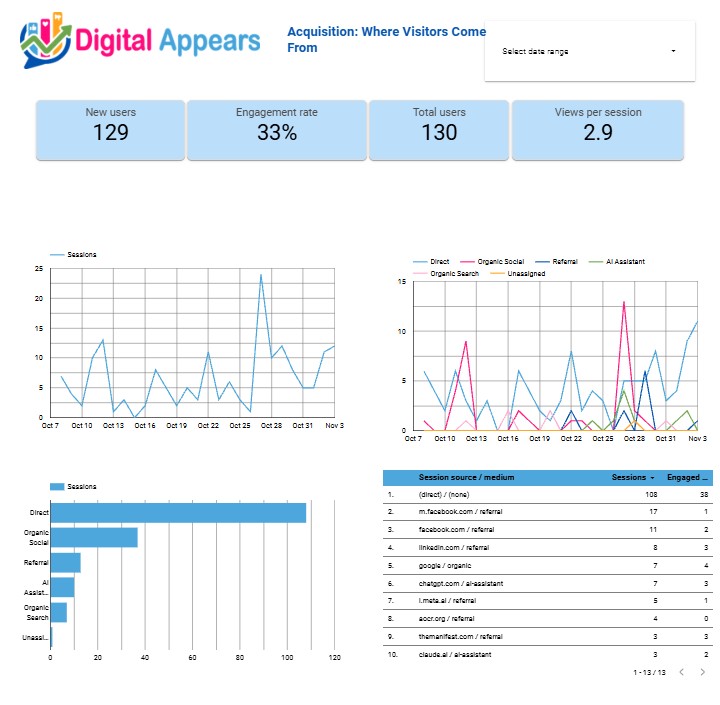
Direct is the biggest bar at a little over 100 sessions, with Organic Social next. AI Assistant, at about 10 sessions, is already larger than Organic Search in this window. The source table shows why: chatgpt.com and claude.ai both appear as AI-assistant sources. That's one reason I wrote about tracking ChatGPT, Gemini and Perplexity traffic in GA4. A big Direct bar is also often visits that arrived without a referrer, so I don't read it as people typing my address.
3. Content
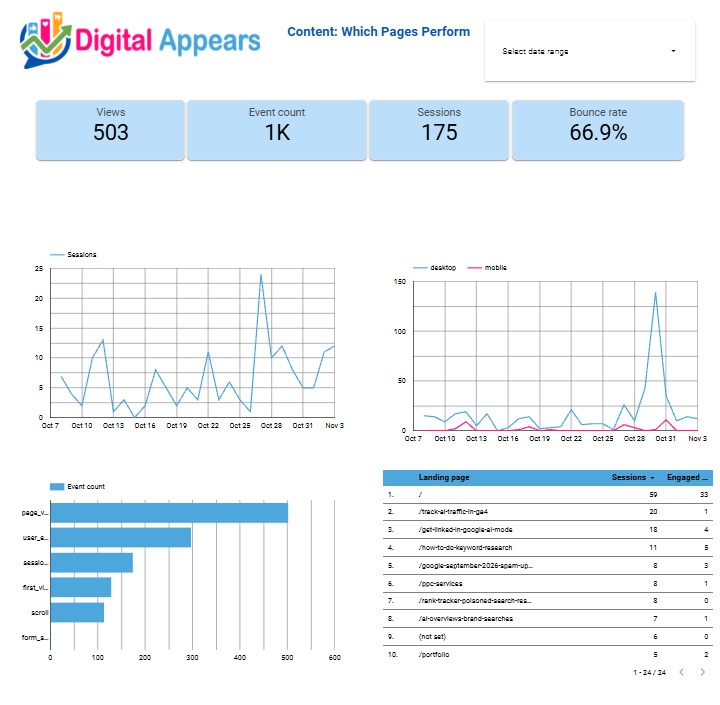
The homepage is the top landing page, followed by my GA4 tracking guide and getting linked in Google AI Mode. I can see at a glance that new content is being read. The landing page table also shows how many of those sessions were engaged, which is a quick way to spot a page that attracts visits but doesn't hold them.
4. Revenue
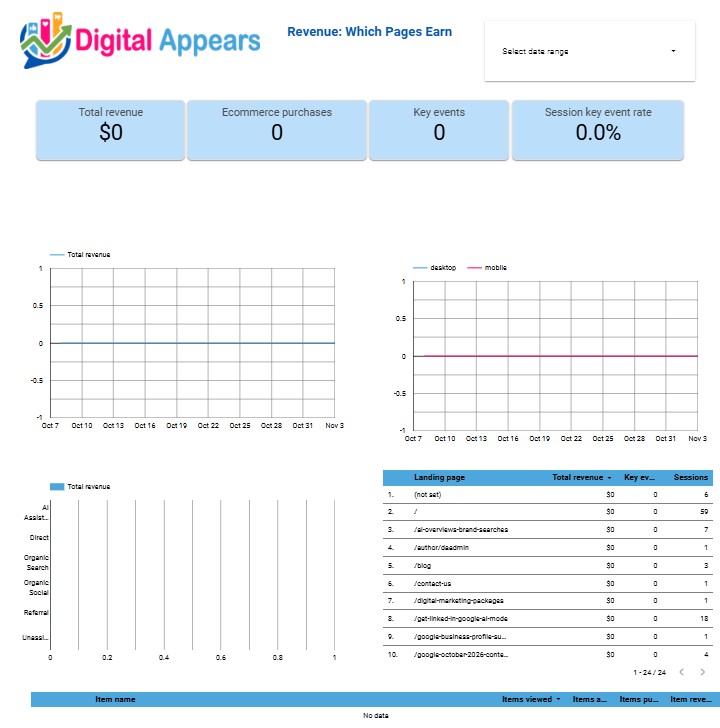
This page answers the question owners care about most: which channel and which page actually earn. It shows total revenue, ecommerce purchases, key events and the session key event rate, then revenue by channel, revenue and key events per landing page, and a product table with views, add-to-carts, purchases and item revenue.
On my site every number here is zero or "No data", and I left it that way on purpose. I don't sell online, and my key events aren't set up yet. For a shop, or for a lead-generation site that marks form submissions as key events, the same page fills itself in once GA4 has the data. If yours stays at zero, check Admin, then Events, and make sure ecommerce events are being sent.
5. Audience
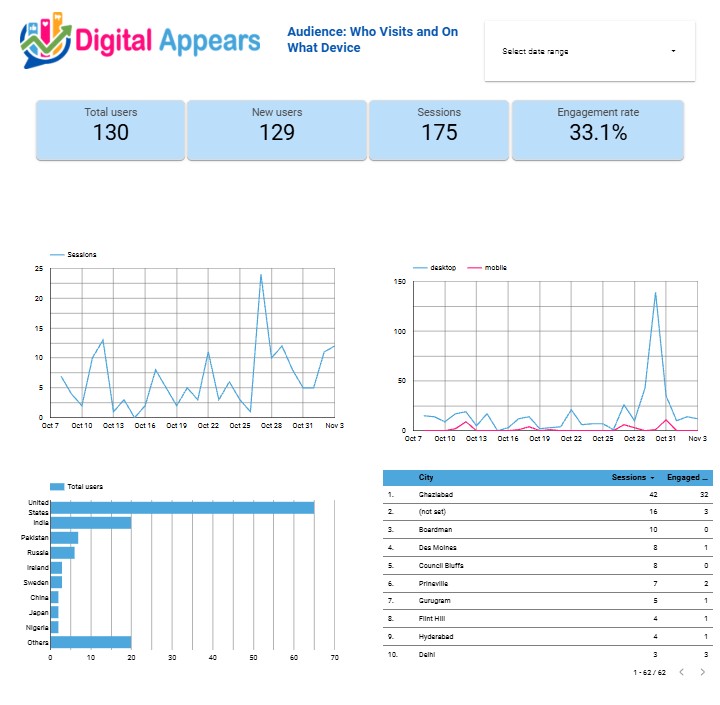
Ghaziabad leads the city table, which is where I'd expect real customers to come from. Further down are cities like Boardman and Des Moines with almost no engaged sessions. I treat those as a sign of automated or low-quality traffic rather than customers, and the table is how I notice it.
6. How to use
The last page is a plain set of five steps inside the report, including a note that blocks showing zero or "No data" are kept on purpose, so anyone you hand a copy to knows what to do without asking you.
Get your own copy
Menu names move around now and then. If a button isn't where I say it is, use the search box in Data Studio or its help pages.
- Check you can see your property in GA4. Open GA4 Admin, then Property access management, and make sure the Google account you'll use is listed. The guides I checked say Viewer access is enough to build a report. If you can't see the property, ask whoever manages it to add you.
- Open the toolkit. Open my GA4 dashboard toolkit while signed in with that same Google account.
- Make a copy. Click the three-dot menu in the top right, then Make a copy. When it asks for a new data source, choose the Google Analytics connector, pick your account and property, and confirm.
- Check the date range. Every page has a date control. Without one, charts default to the last 28 days. I leave mine at the last 28 days.
- Swap in your logo. Replace my logo on each page and adjust the theme under File, then Theme and layout, so it matches your brand.
- Mark your key events in GA4. The Key events tile and the whole Revenue page stay at zero until you mark events such as form submissions as key events, or send ecommerce events, under Admin, then Events.
- Share it, then check the credentials. Use Share to add people or send a link. Then open the data source and look at its credentials setting. With Owner's credentials, viewers see the data without having GA4 access. With Viewer's credentials, people without access may see a "request access" message. Sharing the report and sharing the data are two separate settings.
Prefer to build from scratch? Start a blank report, connect the GA4 connector, add a date control, then add scorecards, a Date and Sessions line chart, a Session default channel group bar and a Page path and Views table. That is the Overview page, and the other pages are variations on it.
Why your numbers won't match GA4 exactly
This is the first complaint I'd expect from anyone who builds a report. The usual causes, in the order I'd check them:
- The date range. Check the report's range against the range in the GA4 report you're comparing with. It's the most common mismatch and the easiest fix.
- Data freshness. GA4 data isn't instant. The guides I read put the delay for standard reports at roughly one to two days, though Google's own figure may differ. Every report footer shows when it was last updated. Check yours when you compare numbers.
- Caching. Data Studio can cache data for speed. The data source has a data freshness setting, and since June 2026 editors can also let viewers refresh the data by hand, per Google's release notes.
- Thresholding and sampling. GA4 can hide or estimate figures for small groups and very large queries, and the two tools don't always treat that the same way.
One more habit that helps: when a number looks off, compare the same metric over the same dates in both places before you change anything.
What this dashboard can't do
The standard connector covers what a small business needs. According to the guides I checked, it doesn't give you cohort data, user-level paths or predictive metrics, and it has no built-in funnel chart. You can fake a funnel with one scorecard per step. For anything deeper, the usual route is GA4's BigQuery export, which needs a Google Cloud project with billing turned on, so costs can apply. I wouldn't start there.
Keep the page small. Every chart runs its own query, so a dashboard with dozens of charts and a default range of "all time" gets slow. A few blocks per page and a 28-day default load quickly.
Is it really free?
The screenshots in this post come from the standard version of Data Studio. Third-party guides describe it as free, with unlimited reports and sharing, and the GA4 connector as free too. Google sells a separate paid tier, Data Studio Pro, which its own materials describe as adding team workspaces, organisation-owned content and Google Cloud support. Per the release notes, Pro became purchasable from the Google Workspace admin console in February 2026.
For a one-person or small-team setup like this, I haven't needed any of the Pro features. Costs appear mainly if you add paid partner connectors or go past BigQuery's free allowance. Terms change, so check Google's current plan details before you rely on "free" for a client project.
How I read it each month
It takes about ten minutes. I ask five questions, in this order:
- Are sessions up or down? I look at the line, not just the tile. My own line has a one-day spike near the end of October, which is why I never judge a month from a single day.
- Are people staying? I compare engaged sessions with sessions. In my report that's 58 out of 175, so about a third.
- Where are they coming from? I watch for a channel that has grown or vanished, and I remember that a big Direct bar can hide visits with no referrer.
- Which pages are pulling? On the Content page, new posts showing up in the top ten is a good sign. A key page missing from it is worth a look.
- Is anything being completed? On the Revenue page I look at key events and, for shops, revenue by channel and landing page. If they are flat at zero, I check GA4 before I blame the site. Then I glance at the Audience page for traffic that looks automated.
FAQ
Is Looker Studio free to use with GA4?
The standard version is described as free by third-party guides, and the GA4 connector is part of it. Google also sells a paid tier, Data Studio Pro, for team workspaces and support. Costs mainly show up with paid partner connectors or BigQuery usage beyond its free allowance. Check Google's current plan details before relying on it.
Is Looker Studio the same as Data Studio?
Yes. Google renamed Looker Studio to Data Studio on 16 April 2026, according to its release notes. The old lookerstudio.google.com address redirected to datastudio.google.com when I tested it.
Do people need GA4 access to see my dashboard?
Not if you set the data source to use the owner's credentials. With the viewer's credentials, people without GA4 access may see a request-access message. Sharing the report and sharing the data source are separate settings.
Why don't my dashboard numbers match GA4?
The usual causes are a different date range, GA4's data delay, cached data, and thresholding or sampling that the two tools handle differently. Compare the same metric over the same dates in both places first.
Do I need BigQuery to build a GA4 dashboard?
No. The standard GA4 connector is enough for a basic dashboard. BigQuery is for deeper analysis such as user-level data, and it needs a Google Cloud project with billing enabled.
Want a dashboard like this for your business?
I can connect your GA4, build the report, and walk you through reading it so it's useful on day one.
Book an Analytics ReviewSources
- Google Cloud: Data Studio release notes (rename, Pro purchasing, viewer refresh)
- Google Cloud blog: An introduction to Looker Studio Pro (what Pro adds)
- NiceLookingData: GA4 and Looker Studio, connection setup and 5 dashboards (third-party, June 2026)
- FindAnomaly: How to connect GA4 to Looker Studio (third-party, April 2026)